
1 Pages (6 items)
Plot range settings get lost if copying a standard 2D plot region - Messages
#1 Posted: 8/16/2026 1:06:19 PM

IMHO this requires immediate fix.
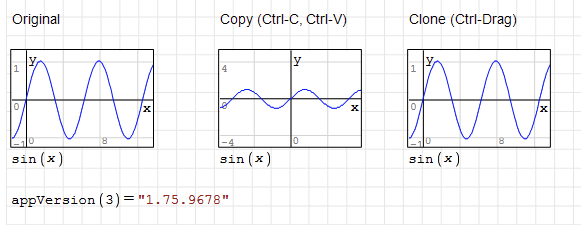
Scaling and shift of origin is lost upon opening the file with version 1.5. The settings are stored in the xml file but obviously ignored upon reading. The same for pasting regions from the clipboard.
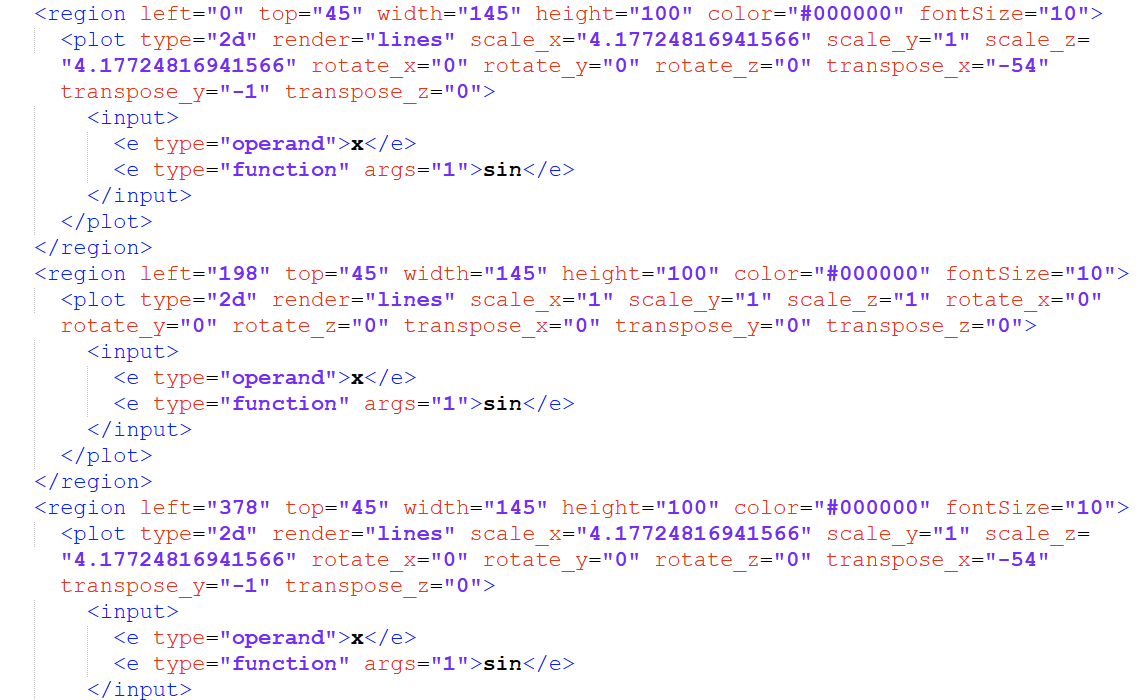
this is how it looks like after saving and re-opening:
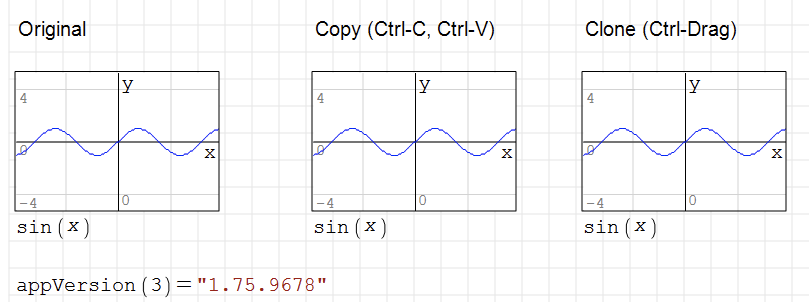
Scaling and shift of origin is lost upon opening the file with version 1.5. The settings are stored in the xml file but obviously ignored upon reading. The same for pasting regions from the clipboard.
this is how it looks like after saving and re-opening:
Edited 8/16/2026 3:15:46 PM
Technische Mechanik mit SMath Studio: https://link.springer.com/book/10.1007/978-3-658-50592-9
1 users liked this post
sergio 8/16/2026 7:12:28 PM
#2 Posted: 8/16/2026 3:31:42 PM

Hello, Martin.
Thank you! I think you're right - this must be fixed ASAP.
I'll handle it.
Best regards.
Thank you! I think you're right - this must be fixed ASAP.
I'll handle it.
Best regards.
2 users liked this post
#3 Posted: 8/17/2026 9:54:13 AM
Cannot reproduce this issue.
Please provide a worksheet.
Thank you in advance!
Please provide a worksheet.
Thank you in advance!
#4 Posted: 8/17/2026 11:52:22 AM
Hello, I repeated the procedure above with slightyl different ranges.
The modified settings are correctly stored in the xml file.
plot2d.sm (4.24 KiB) downloaded 326 time(s).
If I close and re-open the file in the same SMath session, the range is set back to default in all plot regions.
When saving again, these default settings are stored in the file. So there is a danger of spoiling the worksheet permanently. Meanwhile I started to replace the native plot region in the examples for my book by X-Y plot regions. This has the disadvantage of not working in the cloud and of being a bit more complex to handle.
plot2d_2.sm (4.18 KiB) downloaded 286 time(s).
Here is the system information from Development tools.
SMath Studio: SMath Studio 1.5.0.9678 portable, 64-bit
OS: Microsoft Windows NT 10.0.26100.0; Windows 10 Enterprise LTSC 2024, 64-bit
Screen: 3840x2160 px, 144x144 dpi, 96 GP.CDPI
Localization: language=ENG; dec.symbol=; arg.separator=; OS dec.symbol=; OS arg.separator=; OS d.g.separator=; units=eng;
Framework: CLR 4.0.30319.42000
installed versions:
v4
Client 4.8.09032
Full 4.8.09032
v4.0
Client 4.0.0.0
Plugins:
- [AppDir] AreaRegion - 1.75.9678.0
- [AppDir] HTMLFileType - 1.75.9678.0
- [AppDir] ImageFileType - 1.75.9678.0
- [AppDir] MathRegion - 1.75.9678.0
- [AppDir] PictureRegion - 1.75.9678.0
- [AppDir] PlotRegion - 1.75.9678.0
- [AppDir] SMathFileType - 1.75.9678.0
- [AppDir] SpecialFunctions - 1.75.9678.0
- [AppDir] SpecialFunctions - 1.75.9678.0
- [AppDir] StandardToolboxButtons - 1.75.9678.0
- [AppDir] TextRegion - 1.75.9678.0
- [UserDir] CustomFunctions - 1.2.9372.30444
- [UserDir] Development Tools - 1.1.7490.41956
- [UserDir] DotNumerics - 1.1.8269.16536
- [UserDir] Hyperlink Region - 1.0.7806.5225
- [UserDir] Image Region - 2.100.9141.40696
- [UserDir] Mathcad Toolbox - 0.6.9367.4182
- [UserDir] Mathcad Toolbox - 0.6.9367.4182
- [UserDir] MatrixExtensions - 1.0.8302.28555
- [UserDir] MaximaPlugin - 1.98.8797.27896
- [UserDir] Nonlinear Solvers - 1.1.7097.23301
- [UserDir] SnapshotRegion - 1.1.9308.28020
- [UserDir] Statistical Tools - 1.0.9201.22240
- [UserDir] Table Region - 0.3.8770.23606
- [UserDir] X-Y Plot Region (JXCharts) - 0.4.9441.40064
- [UserDir] X-Y Plot Region (JXCharts) - 0.4.9441.40064
The modified settings are correctly stored in the xml file.
plot2d.sm (4.24 KiB) downloaded 326 time(s).
If I close and re-open the file in the same SMath session, the range is set back to default in all plot regions.
When saving again, these default settings are stored in the file. So there is a danger of spoiling the worksheet permanently. Meanwhile I started to replace the native plot region in the examples for my book by X-Y plot regions. This has the disadvantage of not working in the cloud and of being a bit more complex to handle.
plot2d_2.sm (4.18 KiB) downloaded 286 time(s).
Here is the system information from Development tools.
SMath Studio: SMath Studio 1.5.0.9678 portable, 64-bit
OS: Microsoft Windows NT 10.0.26100.0; Windows 10 Enterprise LTSC 2024, 64-bit
Screen: 3840x2160 px, 144x144 dpi, 96 GP.CDPI
Localization: language=ENG; dec.symbol=
Framework: CLR 4.0.30319.42000
installed versions:
v4
Client 4.8.09032
Full 4.8.09032
v4.0
Client 4.0.0.0
Plugins:
- [AppDir] AreaRegion - 1.75.9678.0
- [AppDir] HTMLFileType - 1.75.9678.0
- [AppDir] ImageFileType - 1.75.9678.0
- [AppDir] MathRegion - 1.75.9678.0
- [AppDir] PictureRegion - 1.75.9678.0
- [AppDir] PlotRegion - 1.75.9678.0
- [AppDir] SMathFileType - 1.75.9678.0
- [AppDir] SpecialFunctions - 1.75.9678.0
- [AppDir] SpecialFunctions - 1.75.9678.0
- [AppDir] StandardToolboxButtons - 1.75.9678.0
- [AppDir] TextRegion - 1.75.9678.0
- [UserDir] CustomFunctions - 1.2.9372.30444
- [UserDir] Development Tools - 1.1.7490.41956
- [UserDir] DotNumerics - 1.1.8269.16536
- [UserDir] Hyperlink Region - 1.0.7806.5225
- [UserDir] Image Region - 2.100.9141.40696
- [UserDir] Mathcad Toolbox - 0.6.9367.4182
- [UserDir] Mathcad Toolbox - 0.6.9367.4182
- [UserDir] MatrixExtensions - 1.0.8302.28555
- [UserDir] MaximaPlugin - 1.98.8797.27896
- [UserDir] Nonlinear Solvers - 1.1.7097.23301
- [UserDir] SnapshotRegion - 1.1.9308.28020
- [UserDir] Statistical Tools - 1.0.9201.22240
- [UserDir] Table Region - 0.3.8770.23606
- [UserDir] X-Y Plot Region (JXCharts) - 0.4.9441.40064
- [UserDir] X-Y Plot Region (JXCharts) - 0.4.9441.40064
Technische Mechanik mit SMath Studio: https://link.springer.com/book/10.1007/978-3-658-50592-9
#5 Posted: 9/25/2026 2:29:32 PM
Hello, Martin.
Still cannot reproduce this issue. Your files opened in 1.4 and in 1.5 looks absolutely the same. Changing plots (zoom, move, etc.) works the same in 1.4 and in 1.5. Save/open after changes works the same on both versions as well.
I've dived deeper and checked for changes in Plot Region we did in the time range between 1.4 and 1.5 - zero changes. Which means Plot Region has actually the same code base in both 1.4 and 1.5 versions.
Unfortunately, I can't figure out what happening here and have no idea how to go further.
Is it possible to ask you for screencast with the observation you mentioned?
Best regards, Andrey Ivashov.
Still cannot reproduce this issue. Your files opened in 1.4 and in 1.5 looks absolutely the same. Changing plots (zoom, move, etc.) works the same in 1.4 and in 1.5. Save/open after changes works the same on both versions as well.
I've dived deeper and checked for changes in Plot Region we did in the time range between 1.4 and 1.5 - zero changes. Which means Plot Region has actually the same code base in both 1.4 and 1.5 versions.
Unfortunately, I can't figure out what happening here and have no idea how to go further.
Is it possible to ask you for screencast with the observation you mentioned?
Best regards, Andrey Ivashov.
#6 Posted: 9/26/2026 9:14:26 PM
Hello Andey,
I can't reproduce the problem either. I used exactly the same portable version as in the above postings. The only difference I can see is the Framework version.
When I encountered the problem, it was
installed versions:
v4
Client 4.8.09032
Full 4.8.09032
v4.0
Client 4.0.0.0
Now (after automatic updates of Windows) it is:
installed versions:
v4
Client 4.8.09221
Full 4.8.09221
v4.0
Client 4.0.0.0
The screenshot shows the worksheet plot2d.sm as provided above.
I also tried some of the companion material of the book (which I had to save with version 1.4 in order to keep the plot ranges). I have no idea what could have triggered the reported behaviour of the plot region. The problem gave me a hard time in August, just 4 weeks ago and the workaround was to switch back to SMath 1.4. I didn't try to reproduce the problem since then (actually was using SMath only occasionally as a scratch pad).
Sorry for having created the noise. On the other side, I am happy that by whatever I seem to have gotten rid of the problem by now. I am not really "trusting the peace" as we say in Germany, but I keep fingers crossed.
Best regards, Martin
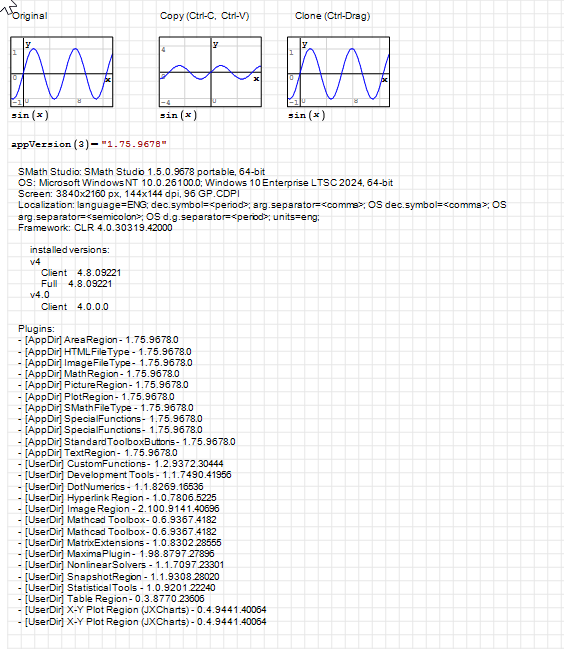
I can't reproduce the problem either. I used exactly the same portable version as in the above postings. The only difference I can see is the Framework version.
When I encountered the problem, it was
installed versions:
v4
Client 4.8.09032
Full 4.8.09032
v4.0
Client 4.0.0.0
Now (after automatic updates of Windows) it is:
installed versions:
v4
Client 4.8.09221
Full 4.8.09221
v4.0
Client 4.0.0.0
The screenshot shows the worksheet plot2d.sm as provided above.
I also tried some of the companion material of the book (which I had to save with version 1.4 in order to keep the plot ranges). I have no idea what could have triggered the reported behaviour of the plot region. The problem gave me a hard time in August, just 4 weeks ago and the workaround was to switch back to SMath 1.4. I didn't try to reproduce the problem since then (actually was using SMath only occasionally as a scratch pad).
Sorry for having created the noise. On the other side, I am happy that by whatever I seem to have gotten rid of the problem by now. I am not really "trusting the peace" as we say in Germany, but I keep fingers crossed.
Best regards, Martin
Technische Mechanik mit SMath Studio: https://link.springer.com/book/10.1007/978-3-658-50592-9
1 Pages (6 items)
- New Posts
- No New Posts